KSE
Friday, April 07, 2006

One of my colleagues wanted an analysis on KSE after the recent fall, so here it goes.
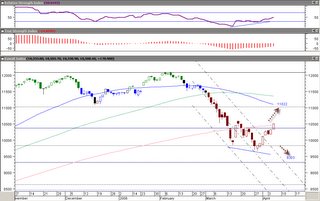
Nice RSI divergence ushered in a good bounce and now testing 200 day sma.
A big White Marubuzo candle around the 200 day sma tells me that it will taken out and we should see a level of 11,022.
However a failure to cross the 200 day sma might see us going lower to the fib confluence zone of 9303.
We are still not out of the woods and i suspect the latter will happen.

The second chart is an interesting one.
I just stumbled upon a 25 day time cycle pattern in KSE. See how neatly important tops/bottoms are formed at those intervals.
Next turndate is around 18th of April 2006. Lets see what the future holds for the index. My guess is we will see an intermediate top around there.
You can always look up all of my charts here.

0 Comments:
Post a Comment
<< Home