KSE 29/4/2006

Saturday, April 29, 2006


ML study Update.

Gold 26/4/06

Wednesday, April 26, 2006


Symmetrical triangle formation in gold.

KSE 22/4/06

Saturday, April 22, 2006


Alrighty, 11,022 - a little shy. 10825 saw a powerful triple top to keep the rise at bay.
That level also coincided with a 50% retracement of the the fall we saw.


What next.. All important level of 10235 which a strong fib confluence zone should hold. Or else we see 9840 for starters as indicated by the ML studies and a possible retest of the previous low of 9670.


Lots of action expected this week!!!

Gold

Wednesday, April 19, 2006


Possible turn date around 21-22 this month based on fibo time lines.

We should not rule out a 8-10% correction at this point in time.

Nifty 13/4/06

Thursday, April 13, 2006


This was very much on the cards after the euphoric rise that we witnessed over the past two months. The indices appeared to have settled down at the lower levels however more is still on the cards. Based on the andrew lines I wouldn't be surprised to see 3140 levels for the Nifty April Future in the coming sessions.

k0Rn

Monday, April 10, 2006


Corn...if a break above 245 can be sustained, we should see a level of 255-258 in the near term.
Its only apt that i am playing korn's -Freak on a leash!


Two of my favorite stocks which i believe will be the darlings of the markets in the coming months, namely Tata Chemicals & ITC.

Nifty Time Extension Analysis

Saturday, April 08, 2006


Though i dont like predicting tops & bottoms , I couldnt afford not to post this chart of Nifty(Weekly).

Is this the intermediate top... let the future takes its course while i get kicks in playing nostradamus!

KSE

Friday, April 07, 2006


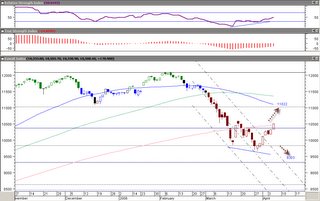
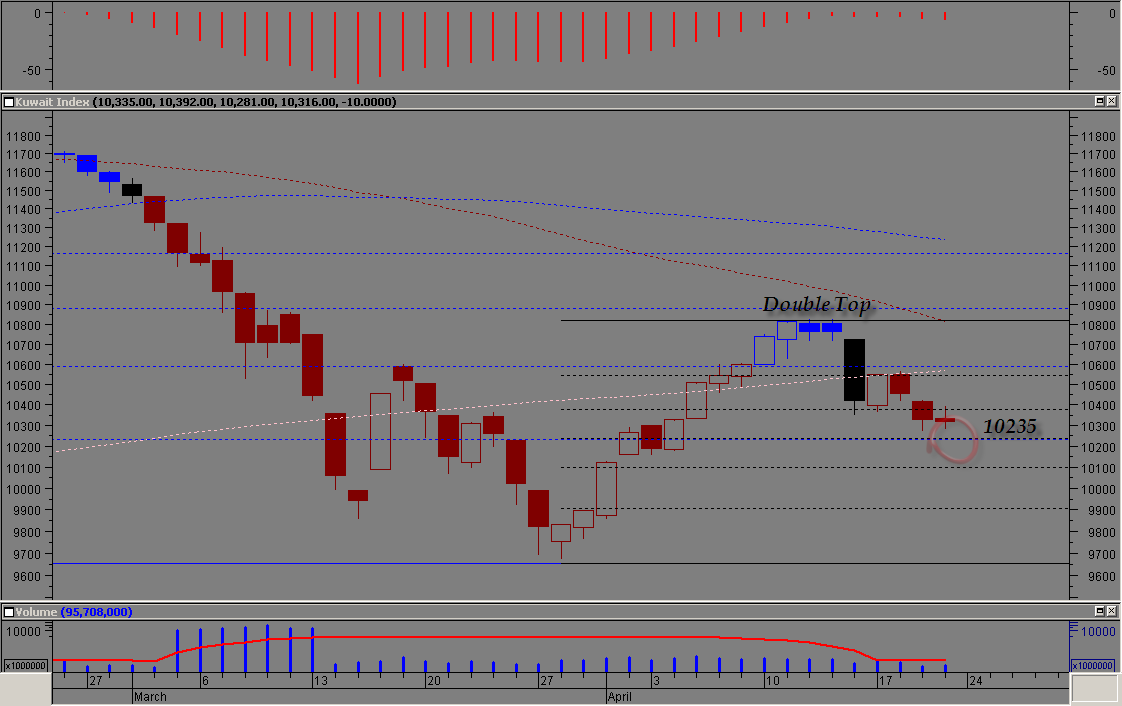
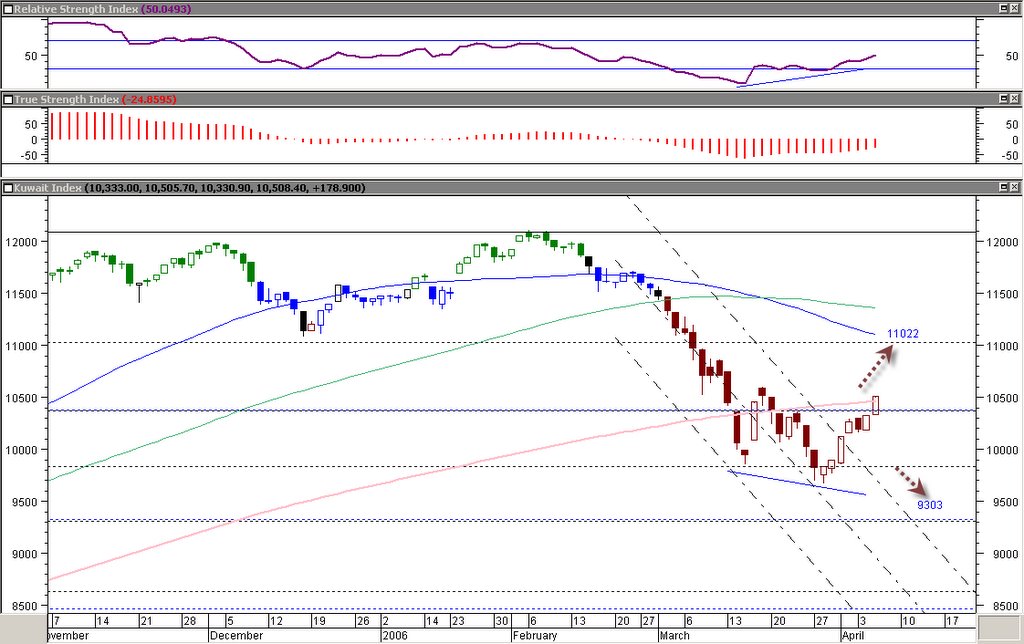
One of my colleagues wanted an analysis on KSE after the recent fall, so here it goes.

Nice RSI divergence ushered in a good bounce and now testing 200 day sma.

A big White Marubuzo candle around the 200 day sma tells me that it will taken out and we should see a level of 11,022.

However a failure to cross the 200 day sma might see us going lower to the fib confluence zone of 9303.

We are still not out of the woods and i suspect the latter will happen.


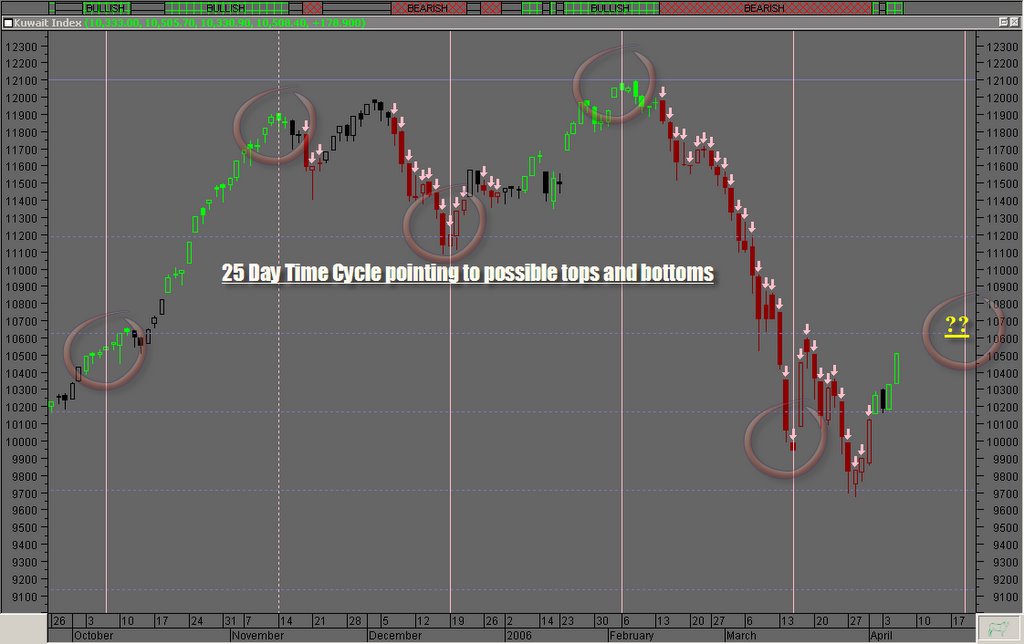
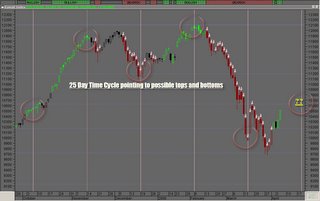
The second chart is an interesting one.
I just stumbled upon a 25 day time cycle pattern in KSE. See how neatly important tops/bottoms are formed at those intervals.

Next turndate is around 18th of April 2006. Lets see what the future holds for the index. My guess is we will see an intermediate top around there.

You can always look up all of my charts
here.